What are Excel Data Tables?

The “Data Table” item under the Excel’s “What-If” menu makes a rudimentary sensitivity analysis table in Excel.

Make and Modify Excel Data Tables Quickly

It normally takes quite a few steps to make an Excel Data Table. Skip the work and get nicely formatted data tables quickly with Sensitivity Explorer. Need to change your table? That's even faster, as the software remembers your setup.

Learn More

Go Beyond with Graphs and Summaries

Go beyond the tabular format; with Sensitivity Explorer it is just as quick and easy to present the information in the form of graphs and verbal summaries.

Learn More

Excel Data Tables ...in seconds

01

Save Time on Setup

View all the options at a glance.
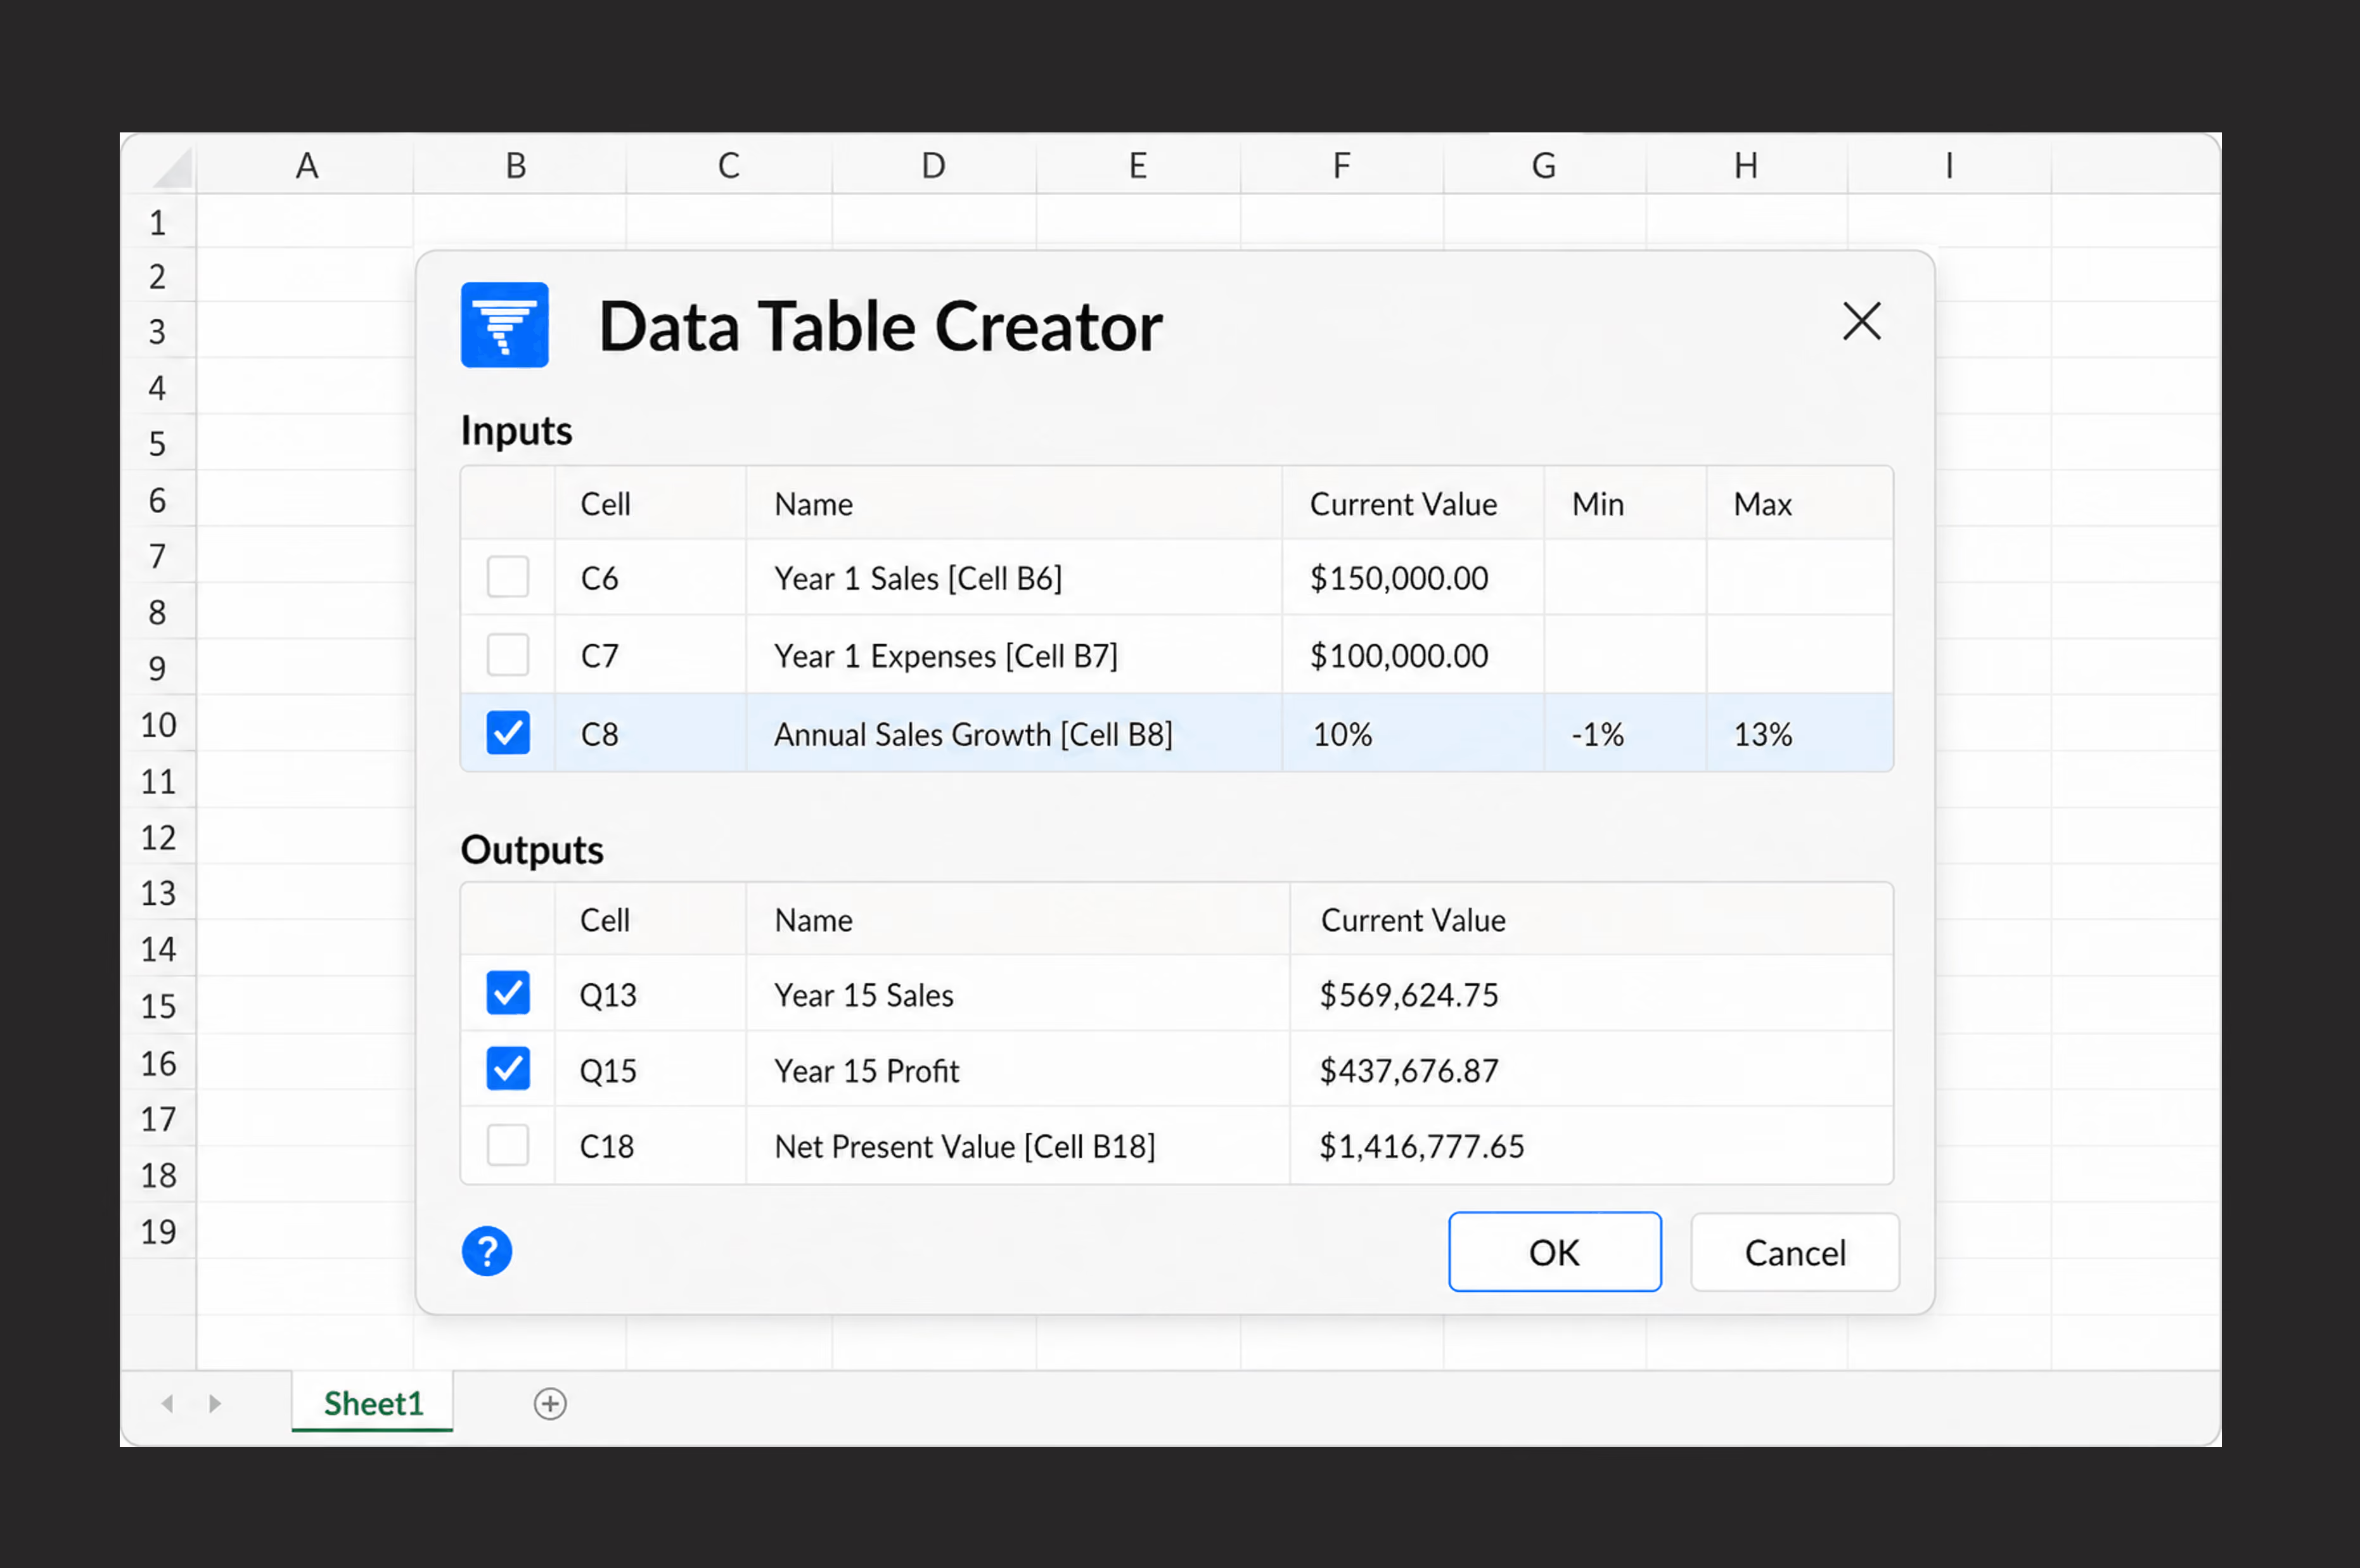
Data Table Creator dialog box over a spreadsheet showing inputs and outputs tables; inputs list Year 1 Sales $150,000, Year 1 Expenses $100,000, and Annual Sales Growth 10% (highlighted, checked) with min -1% and max 13%; outputs list Year 15 Sales $569,624.75 (checked), Year 15 Profit $437,676.87 (checked), and Net Present Value $1,416,777.65; buttons OK and Cancel appear at bottom.

02

Save Time on Formatting

Excel Data Tables come with no formatting; let the Explorer format them for you.
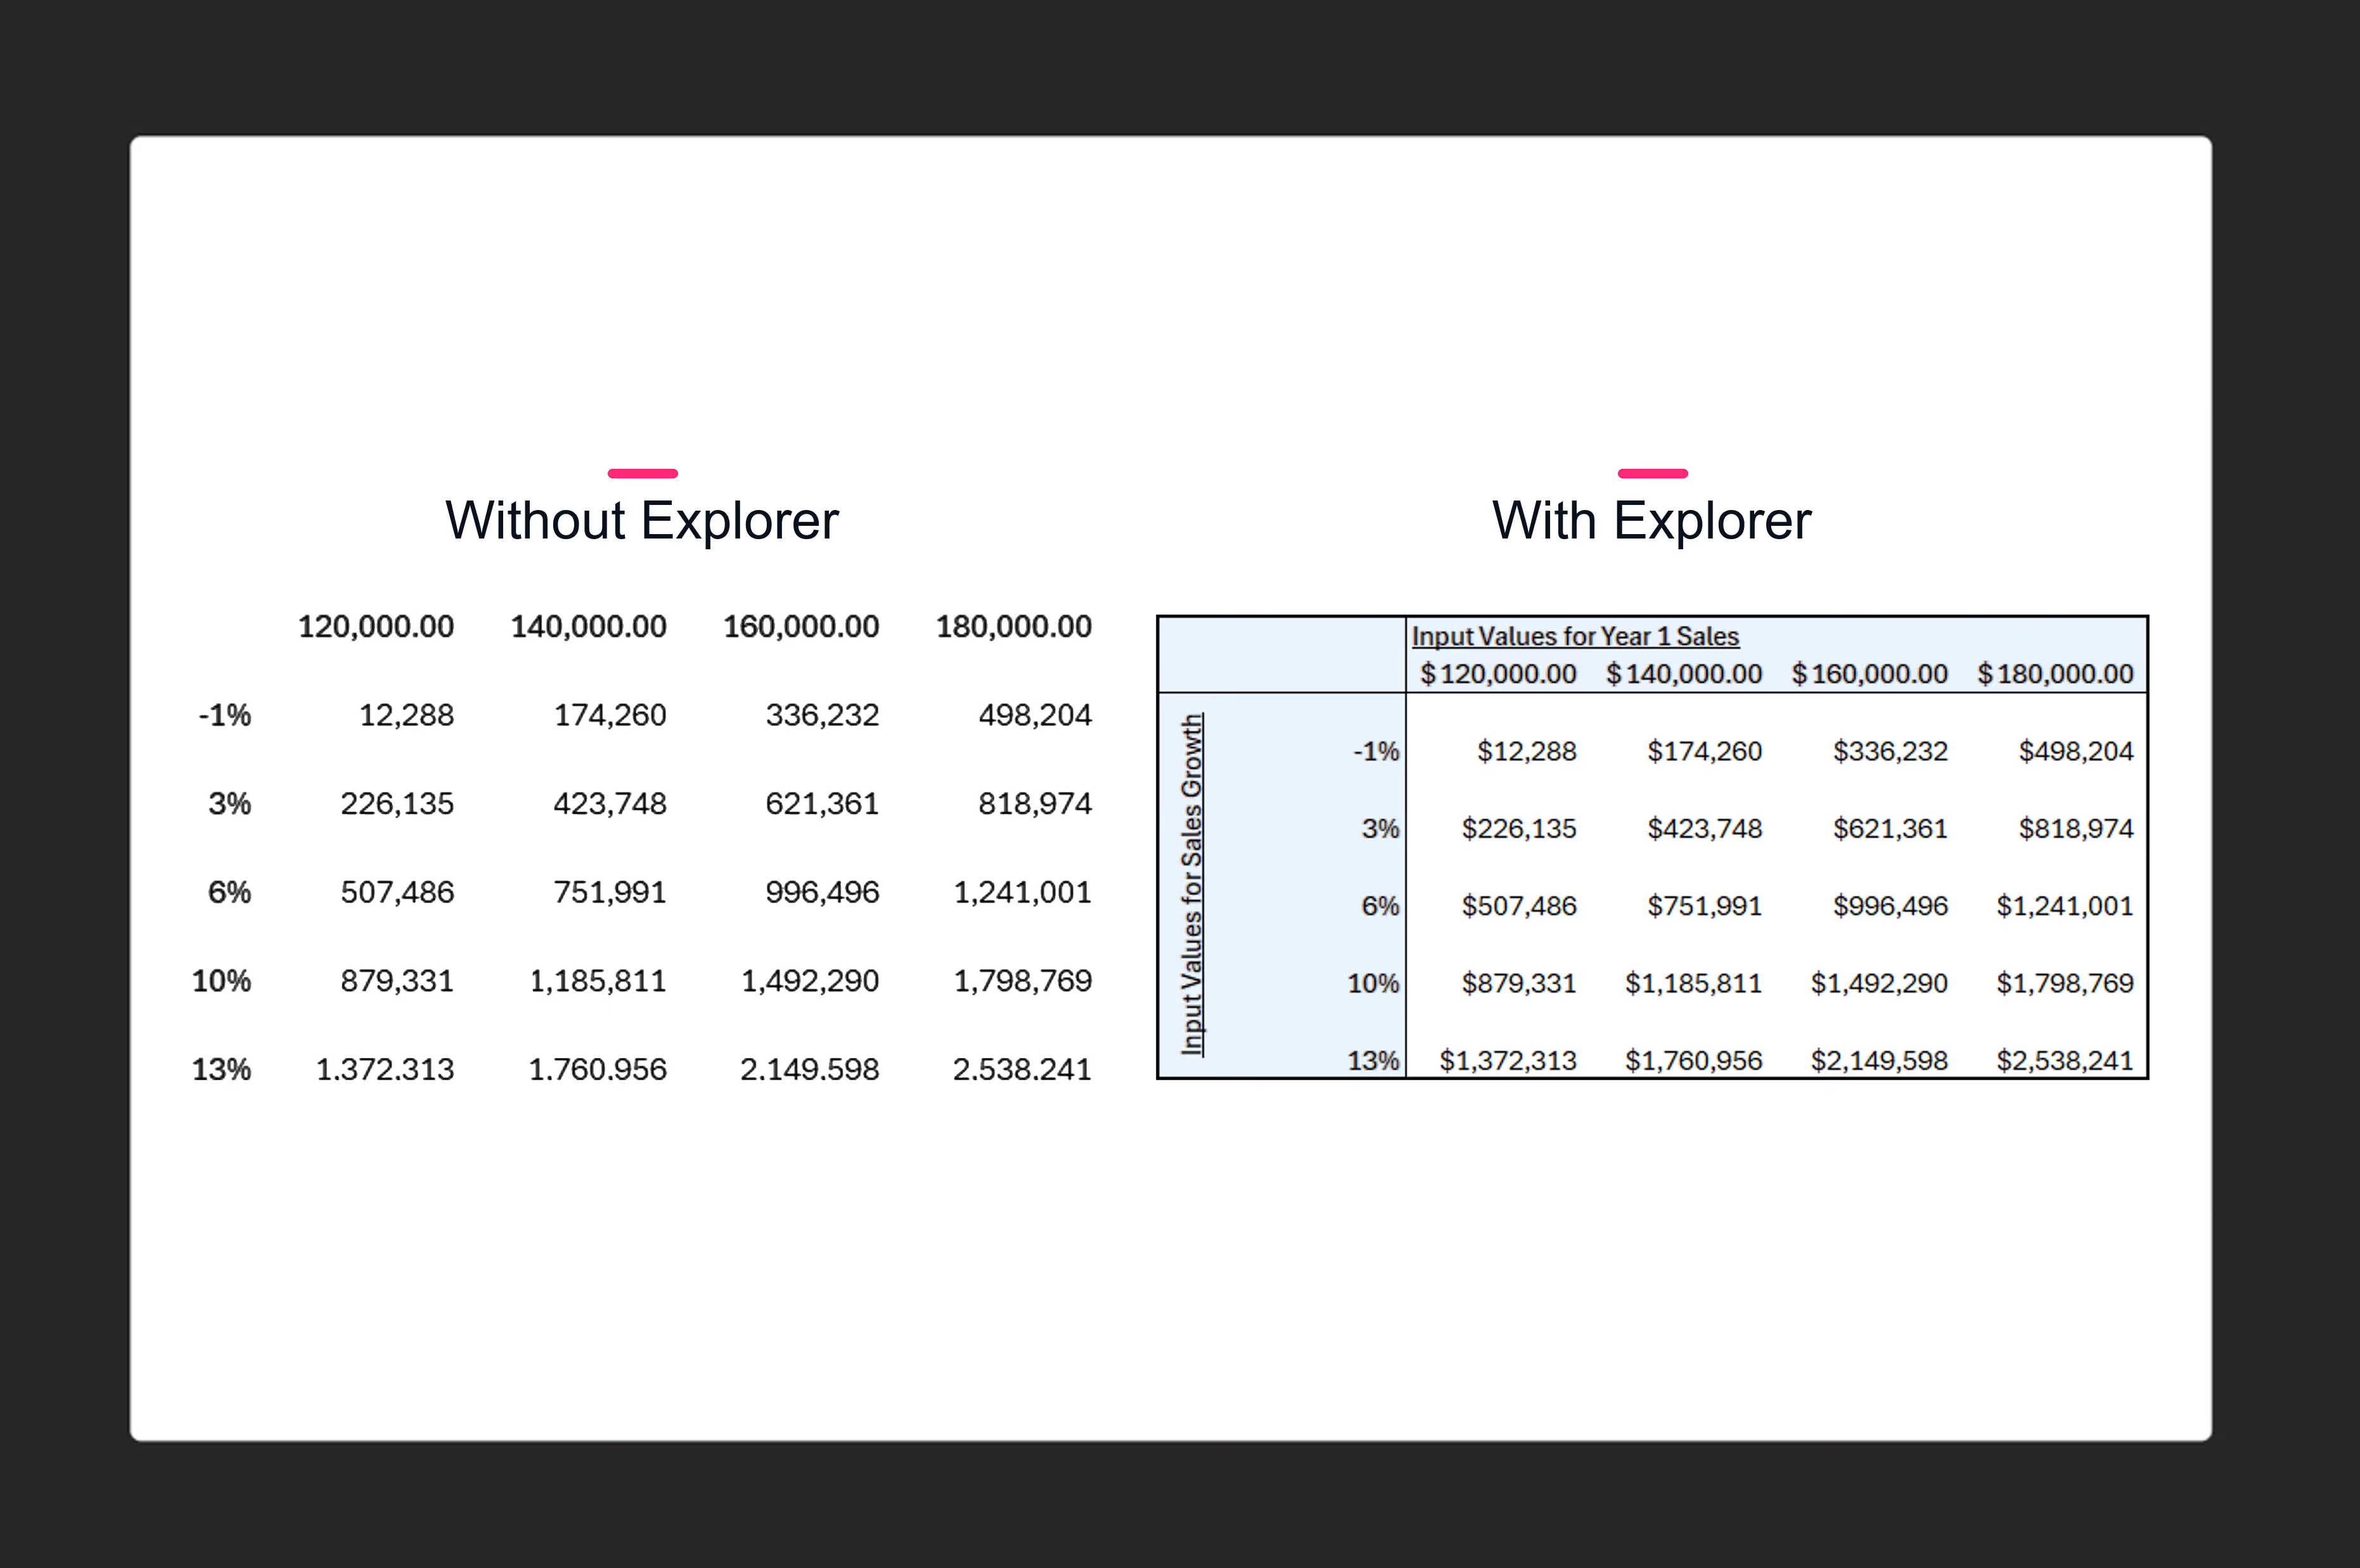
Comparison of sales data tables titled 'Without Explorer' and 'With Explorer', each showing sales growth rates of -1%, 3%, 6%, 10%, and 13% across sales amounts of $120,000, $140,000, $160,000, and $180,000 with corresponding sales figures listed.

03

Save Time on Editing

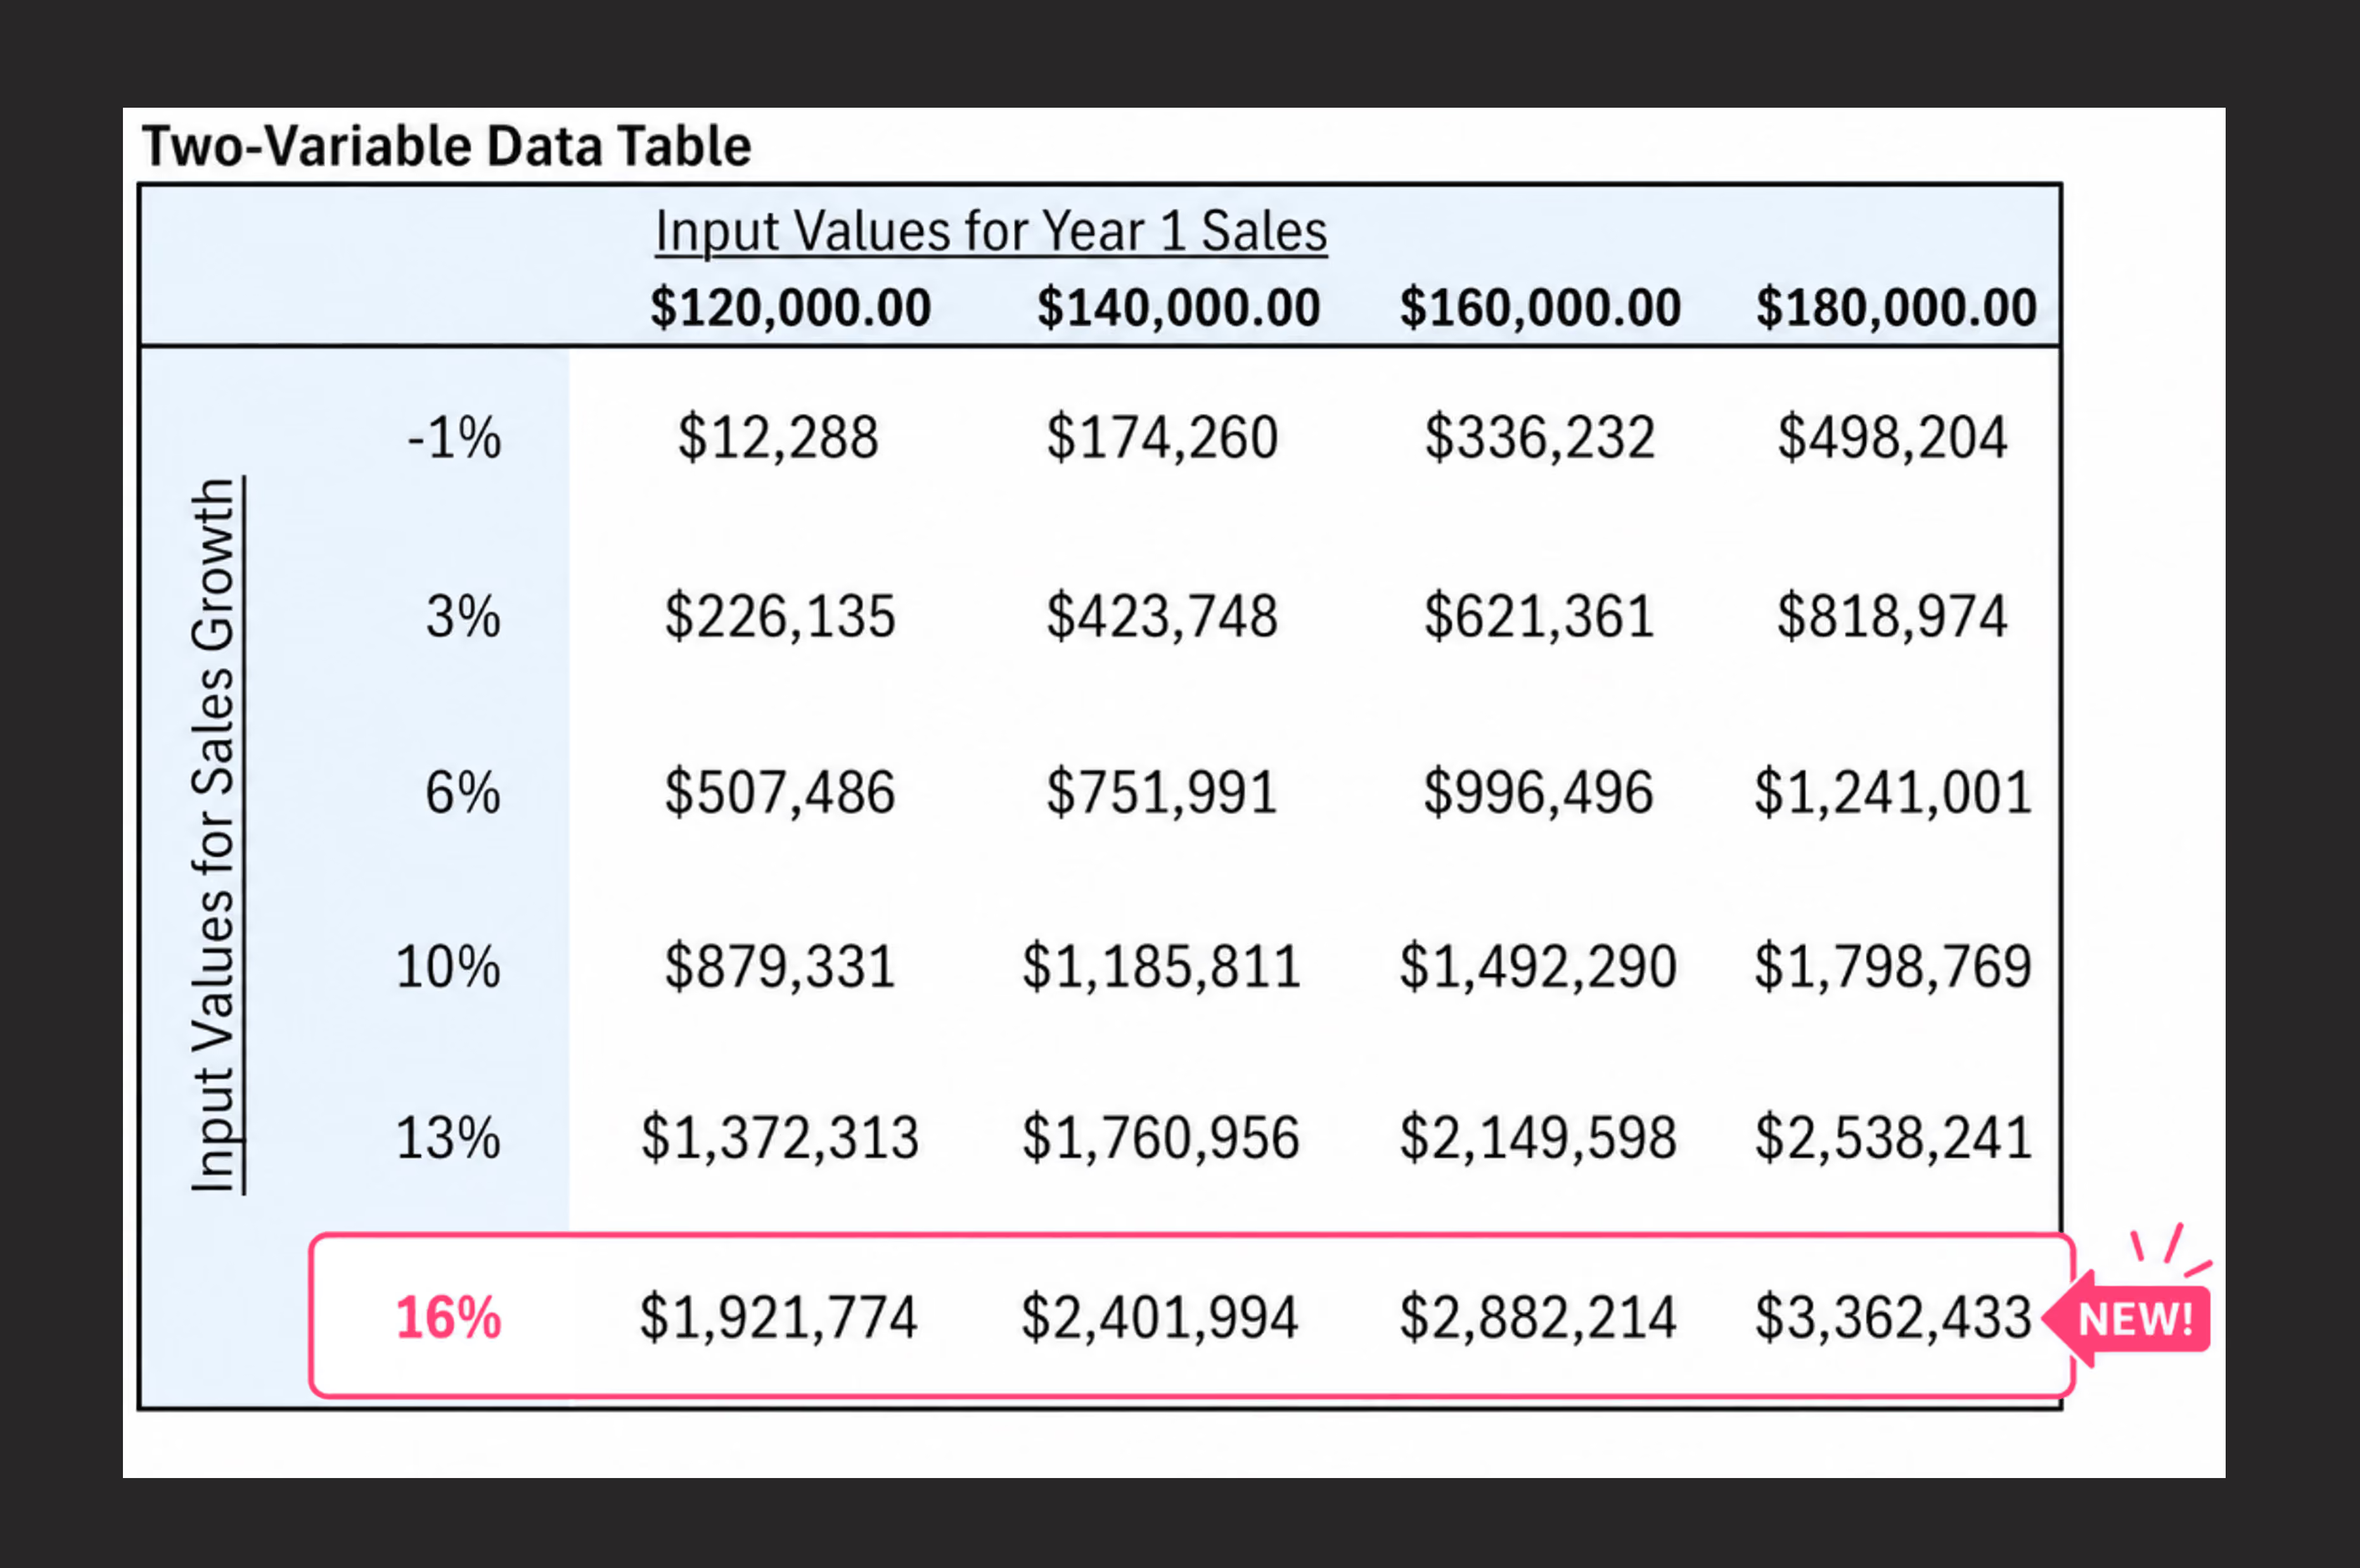
Add outputs or change the number of rows in seconds.

Try Now
Two-variable data table showing input values for Year 1 Sales ranging from $120,000 to $180,000 across columns and input values for sales growth from -1% to 13% down rows, with a newly added 16% sales growth row highlighted in pink showing values from $1,921,774 to $3,362,433.